The Real Math: How Long Until Your Solar Inverter Pays for Itself?
Let's cut through the sales fluff. You're not here for "save the planet" speeches. You want to know: if I drop $$15,000$$25,000 on a solar inverter system, when do I start seeing actual profit?
The answer isn't simple—but it's more favorable than most people think.
The Three Numbers That Matter
Before we run any calculations, you need three data points:
-
Your monthly electric bill (the baseline you're eliminating)
-
Your local utility rate structure (flat rate vs. Time-of-Use)
-
Available incentives (30% federal ITC + state rebates)
Here's where it gets interesting. The type of inverter you choose dramatically affects all three.
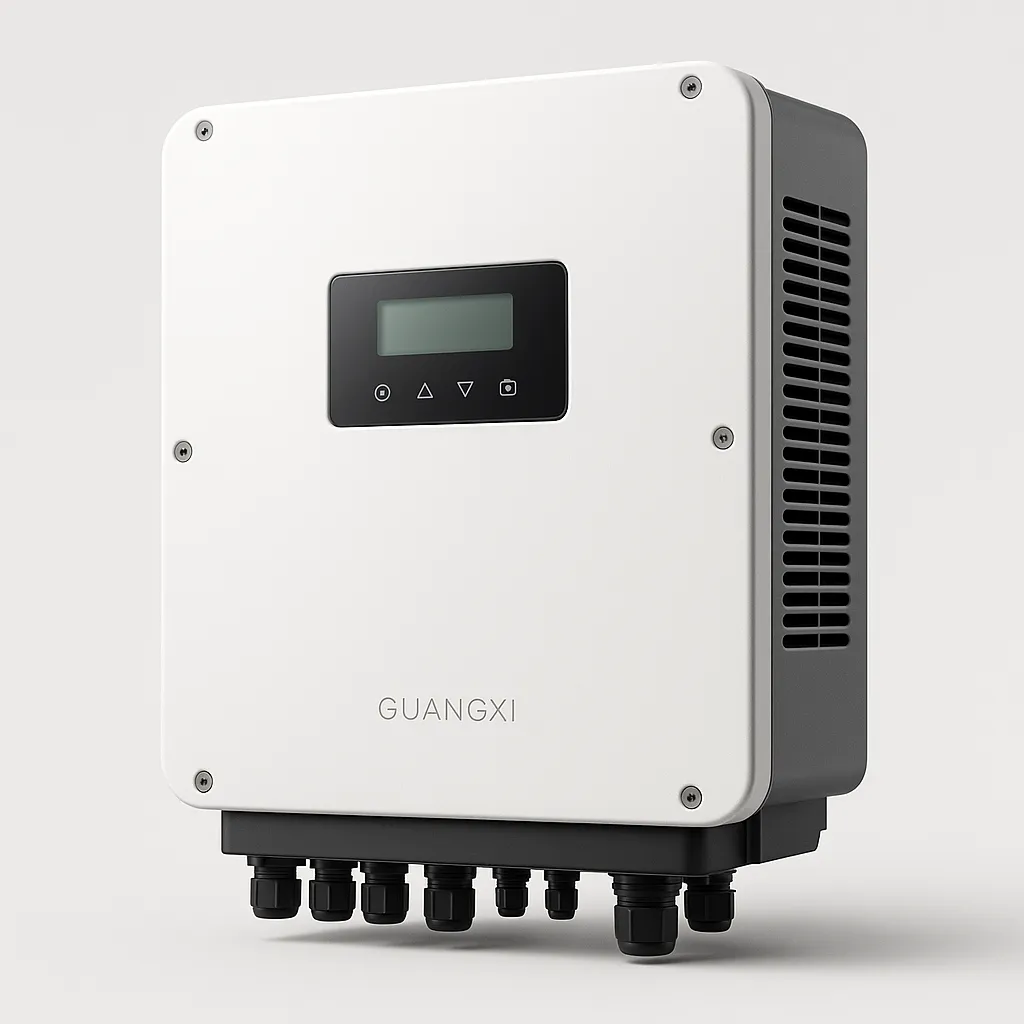
String Inverter vs. Hybrid Inverter: The ROI Divide
A traditional grid-tied string inverter costs less upfront ($$5,000$$8,000 for a typical 8kW system). But under California's NEM 3.0 rules, it's become a financial trap.
Why? Under NEM 3.0, utilities pay you ~$$0.03/kWh for excess solar but charge$$0.40-$0.50/kWh during peak hours (4-9 PM). Your panels produce power at noon when rates are low—but you consume power at 6 PM when rates are highest.
Result: A grid-tied system that used to pay for itself in 5-6 years now stretches to 10+ years.
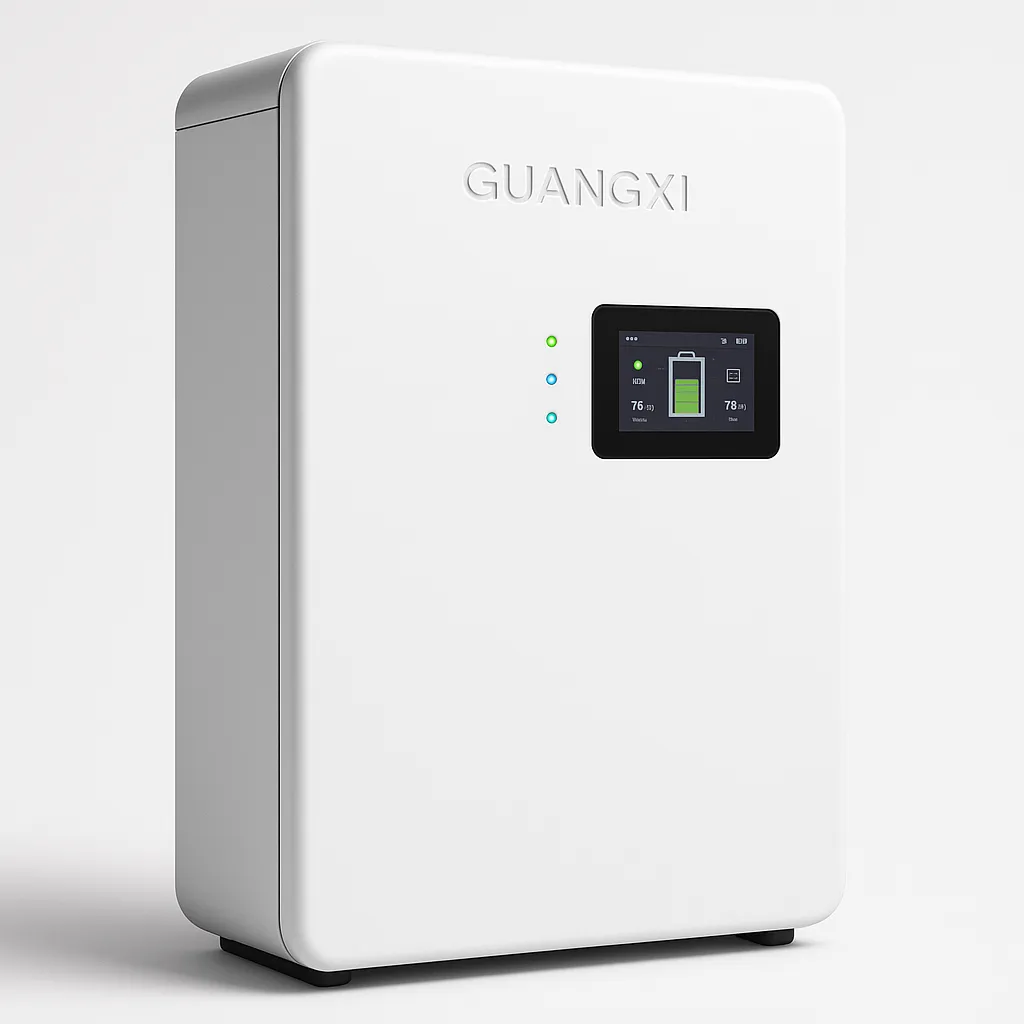
The Hybrid Advantage: Storing Your Way to Profit
A hybrid inverter with battery storage changes the equation entirely. Instead of selling cheap noon power to the grid, you store it. Then you discharge during expensive peak hours.
Real numbers from CASE-002:
A California homeowner in San Jose faced $$350/month electric bills. After installing a 10kW hybrid inverter with Time-of-Use optimization, his self-consumption jumped from 40% to 88%. His new monthly bill:$$45.
Let's break down the math:
|
Metric
|
Value
|
|
|
$350
|
|
Post-solar monthly bill
|
$45
|
|
Monthly savings
|
$305
|
|
Annual savings
|
$3,660
|
|
System cost (before ITC)
|
$28,000
|
|
System cost (after 30% ITC)
|
$19,600
|
|
Payback period
|
5.4 years
|
After year 5, every kilowatt-hour is essentially free electricity for the remaining 20+ year lifespan of the system.
The NEM 3.0 Survival Guide
California's 2023 net metering changes hit homeowners hard. But here's what most installers won't tell you: the rules reward battery storage.
The new economics:
-
Exporting solar to grid: ~$0.03/kWh
-
Avoided peak consumption: $$0.40$$0.50/kWh
-
Premium for stored solar: 13x higher value
SolarInverterUS hybrid units feature built-in, fully automated Time-of-Use programming. You configure your utility's peak hours once in the app, and the inverter autonomously charges batteries at noon and discharges during peak rates.
"After NEM 3.0 passed, I was terrified of my power bills," reported Sarah M. from California. "This inverter's TOU settings are brilliant. It automatically charges my batteries when grid power is cheap and discharges during peak hours." (FEEDBACK-002)
Texas: A Different Calculation
Texas doesn't have net metering in the traditional sense—most utilities buy back solar at wholesale rates (~$$0.02$$0.04/kWh). But Texas has something else: an unstable grid.
The ROI equation shifts:
In Texas, you're not just calculating electric bill savings. You're calculating the avoided cost of:
-
Hotel stays during multi-day outages ($150/night)
-
Frozen pipes and water damage ($$5,000$$20,000)
-
Lost refrigerated food ($$300$$500 per outage)
-
Portable generator fuel ($$20$$50/day)
A Texas homeowner in Austin (CASE-001) invested $12,500 in an 8kW hybrid system with 15kWh battery. His electric bill dropped 70%, but more importantly, his family stayed powered through 18 hours of spring storm outages.
True payback calculation:
-
Annual electric savings: $1,800
-
Avoided outage costs (conservative estimate): $500/year
-
Total annual benefit: $2,300
-
Payback period: ~5.4 years
The Federal Tax Credit: Your 30% Head Start
The Inflation Reduction Act extended the 30% Investment Tax Credit (ITC) through 2032. This isn't a deduction—it's a direct credit against your federal tax liability.
Example:
Some states offer additional incentives:
-
California: Self-Generation Incentive Program (SGIP) rebates up to $1,000/kWh for battery storage
-
New York: NYSERDA incentives up to $5,000
-
Texas: Property tax exemption for solar installations
The Hidden Value: Home Appreciation
Studies by Zillow and the National Renewable Energy Laboratory (NREL) consistently show solar installations increase home value by 4-6% [Source: NREL, 2024].
For a $$500,000 home, that's$$20,000-$30,000 in added value—instantly recouping your investment if you sell.
When the Math Doesn't Work
Solar isn't right for every situation. Here's when to walk away:
-
You're moving in under 3 years: Payback typically takes 5-7 years
-
Heavy shading: If trees block 50%+ of your roof, production drops dramatically
-
Low electricity rates: If you pay <$0.10/kWh, savings accumulate slowly
-
Old roof needing replacement: Solar panels last 25+ years; install on a roof with 10+ years of life
The Decision Framework
Choose String Inverter (grid-tied only) if:
-
Your utility has favorable net metering (rare post-NEM 3.0)
-
You don't care about backup power
-
Budget is the only constraint
Choose Hybrid Inverter (with battery) if:
-
You're in California, Texas, or any state with TOU rates or grid instability
-
You want protection during outages
-
You're planning to stay in your home 5+ years
Sample ROI Scenarios
Scenario 1: California Homeowner, 1,200 kWh/month
|
Factor
|
Value
|
|
Pre-solar bill
|
$350/month
|
|
Post-solar bill
|
$45/month
|
|
System cost (after ITC)
|
$19,600
|
|
Annual savings
|
$3,660
|
|
Payback
|
5.4 years
|
|
25-year savings
|
$91,500
|
Scenario 2: Texas Homeowner, 1,200 kWh/month
|
Factor
|
Value
|
|
Pre-solar bill
|
$180/month
|
|
Post-solar bill
|
$54/month
|
|
System cost (after ITC)
|
$8,750
|
|
Annual savings
|
$1,512
|
|
Outage protection value
|
$500/year
|
|
Payback
|
4.4 years
|
|
25-year savings
|
$50,300
|